Fuel food correlation pipe line
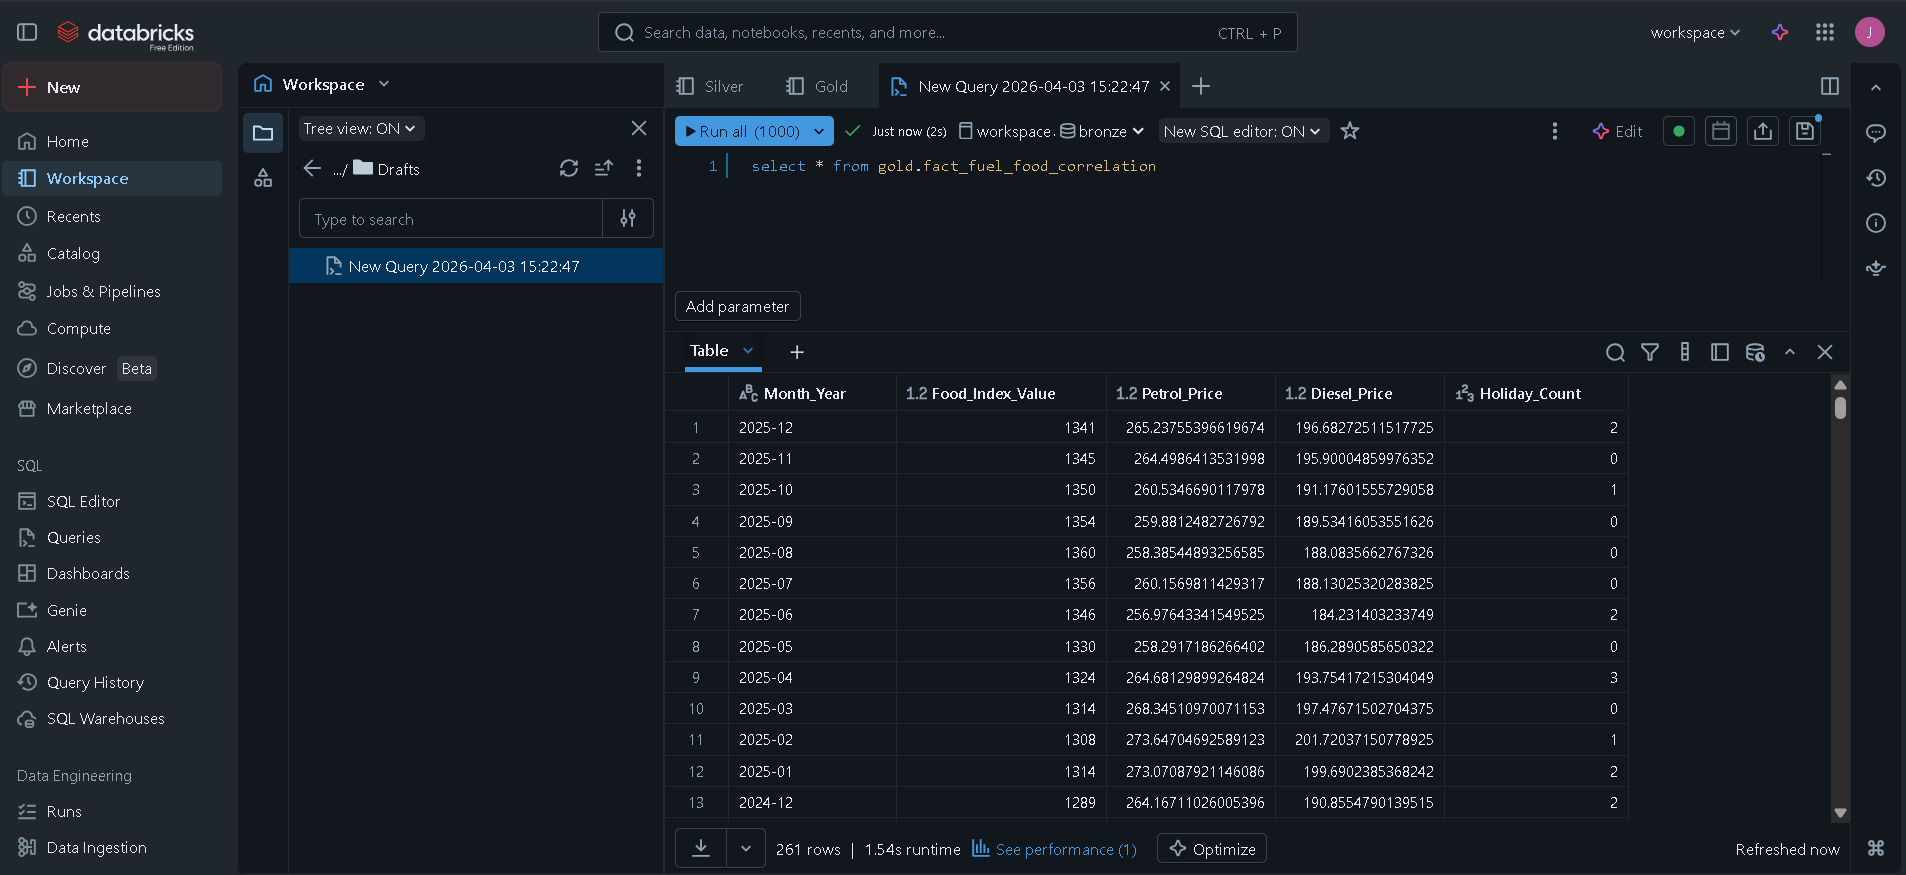
📊 NZ Fuel & Food Price Correlation Pipeline 🚀 Project Overview This project is a Data Engineering Pipeline built in Databricks to analyze the economic relationship between gasoline price fluctuations and the Food Price Index (FPI) in New Zealand. The goal was to determine if spikes in fuel (specifically Diesel and Regular Petrol) directly correlate with rising food costs, and to identify any "time-lags" in this relationship. 🏗️ Architecture: The Medallion Approach The pipeline follows the Medallion Architecture to ensure data quality and scalability: Bronze Layer: Raw ingestion of Stats NZ and Fuel Price CSV files into Delta tables. Silver Layer: * Data cleaning and type casting. Feature Engineering: Created a custom dim_date table using the Python holidays library to flag New Zealand public holidays. Aggregation: Downsampled daily fuel prices to a monthly mean to match the Food Price Index grain. Gold Layer: * Implemented a Star Schema design. Created a fact_fuel_food_correlation table by joining processed fuel, food, and date dimension data. 🛠️ Tech Stack Platform: Databricks (Community Edition) Language: PySpark (Python) and Spark SQL Storage: Delta Lake Orchestration: Logic designed for integration with Airflow/Databricks Workflows Libraries: pandas, pyspark.sql.functions, holidays 📈 Key Features & Logic Movable Holiday Logic: Automated detection of NZ-specific holidays (like Matariki and Easter) using the holidays library to account for seasonal price anomalies. Data Normalization: Transformed the "1960M01" date format into standard SQL timestamps for seamless joining. Business Intelligence Ready: The Gold layer is optimized for PowerBI/Tableau, pivoting fuel types into individual columns for immediate correlation analysis. 📂 Repository Structure Bronze/: Notebooks for raw data ingestion. Silver/: Transformation logic and Dimension table creation. Gold/: Final Star Schema modeling and join logic. SourceData/: Sample CSV datasets used in the pipeline.
Super store
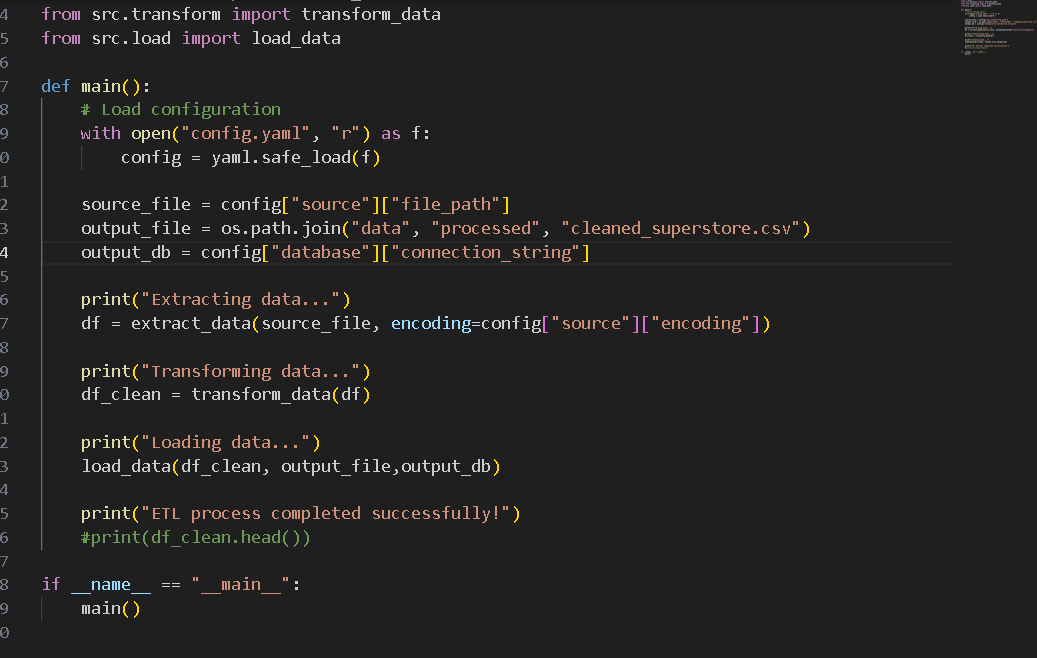
# Superstore ETL Pipeline This project is a Python-based ETL (Extract, Transform, Load) pipeline for processing Superstore sales data. It takes raw sales data in CSV format, cleans and standardizes it, and outputs the processed data to both a cleaned CSV file and an SQLite database. ## Project Structure ```text superstore_etl/ ├── main.py # Main execution script to run the ETL pipeline ├── config.yaml # Configuration file with source and database paths ├── notebooks/ # Directory for Jupyter notebooks (e.g., data exploration) ├── data/ │ ├── source/ # Raw source data (e.g., Sample - Superstore.csv) │ └── processed/ # Processed outputs (cleaned CSV, SQLite DB) └── src/ ├── extract.py # Data extraction logic (reads CSV) ├── transform.py # Data cleaning, imputation, and transformation logic └── load.py # Logic to load data into CSV and SQLite ``` ## How It Works 1. **Extract (`src/extract.py`)**: Reads the raw CSV data from the path specified in `config.yaml` using the configured encoding. 2. **Transform (`src/transform.py`)**: Cleans the data by: - Handling and imputing missing values with "Unknown" or `0`. - Removing duplicate records. - Casting date columns (`Order Date`, `Ship Date`) to correct datetime formats. - Trimming whitespace and standardizing string formats (Title Casing). - Validating numeric columns (`Sales`, `Quantity`), filtering out strictly non-positive values. - Standardizing column names (lowercase with underscores) to prepare them for a database insertion. 3. **Load (`src/load.py`)**: Exports the cleaned `pandas` DataFrame to a processed CSV file and loads it into an SQLite database (`cleaned_superstore` table) specified in the config. ## Setup and Installation 1. Ensure you have Python installed. 2. Install the necessary dependencies: ```bash pip install pandas pyyaml ``` 3. Place the raw data file into the appropriate directory as specified in `config.yaml` (e.g., `data/source/Sample - Superstore.csv`). ## Usage To run the full ETL pipeline, simply execute the `main.py` script: ```bash python main.py ``` This will read the configuration, perform the data extraction, transformation, and load processes, and output success and completion messages to the console.
Data Cleaning Project
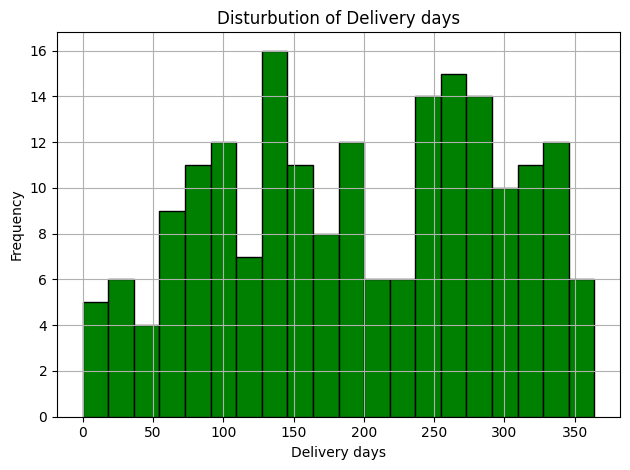
Data Cleaning and Analysis Project This project demonstrates a basic workflow for cleaning, transforming, and analyzing order/shipping data using Python (pandas & numpy). Project Overview Load and explore raw data Handle missing values and inconsistent entries Convert data types and standardize fields Perform feature engineering (delivery days, status, domestic/international) Generate summary statistics and insights Export cleaned dataset for further analysis File Structure data/ - Raw data sample notebooks/ - Jupyter Notebook with step-by-step analysis output/ - Cleaned data and results Insights Average shipping cost by company Delivery status breakdown Top shipping companies Orders by country and city